
| General Usage | ||
|---|---|---|

|

|
|
| Installation | Callgraph Perspectives | |
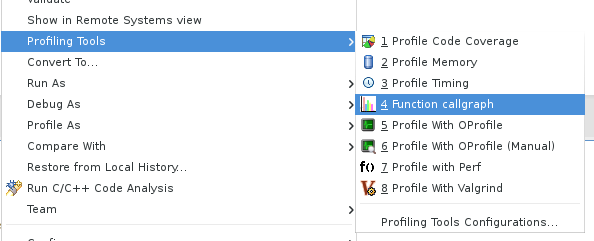
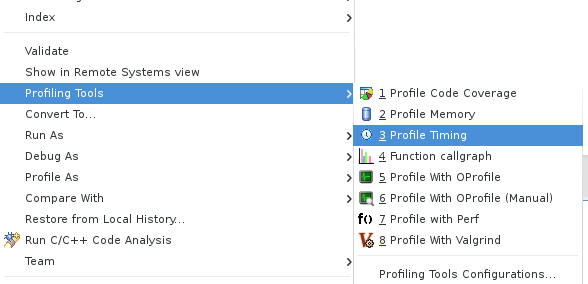
All the profiling plugins (including Eclipse Callgraph) are accessible from the C/C++ perspective. There are two ways to start using Eclipse Callgraph via the Profiling Tools project menu:
Using Profiling Tools > Function callgraph

or using Profiling Tools > Profile Timing and setting the timing tool to be Callgraph.

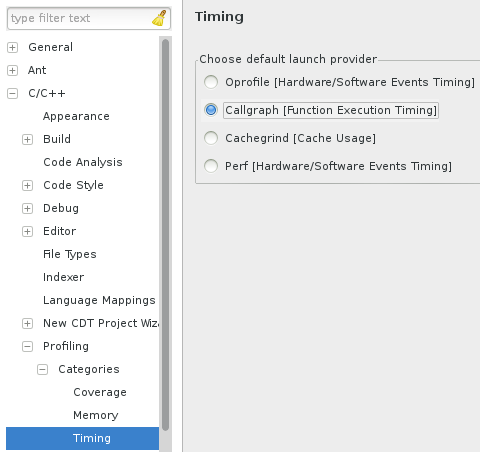
To properly set the preferences you can go to C/C++->Profiling->Categories->Timing and set the default timing tool to be Callgraph.

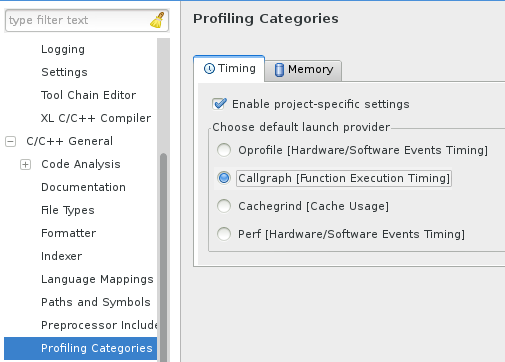
Alternatively, you can set project specific preferences which override workspace preferences by using project Properties->C/C++ General->Profiling Categories->Timing.

You can also profile your application using Profile as...->Local C/C++ Application whereby you have set the profiling tool in the Profiler tab to be Callgraph.

This will open a dialog from which you can select an executable to profile.

After selecting an executable to profile, Eclipse Callgraph will ask which files to probe. By default, all source files in the project will be selected.


|

|

|
| Installation | Callgraph Perspectives |